Showing posts with label MJ2015/12. Show all posts

Thursday, November 15, 2018

9702/May Jun/12/2015/Q6

A single sheet of aluminium foil is folded twice to produce a stack of four sheets. The total thickness of the stack of sheets is measured to be (0.80 ± 0.02) mm. This measurement is made using a digital caliper with a zero error of (−0.20 ± 0.02) mm.

What is the percentage uncertainty in the calculated thickness of a single sheet?

A 1.0%                        B 2.0%                        C 4.0%                        D 6.7%

Solution:
Answer: C

This challenging question involves both random and systematic error.

The zero error (−0.20) can be removed but its uncertainty (± 0.02) must be added to the measurement uncertainty.
True value of total thickness = 0.80 + 0.20 = 1.0 mm  
Total uncertainty in measurement = ± (0.02 + 0.02) = ± 0.04

So the four sheets have a true thickness of (1.00 ± 0.04) mm.
A single sheet would have a thickness of (0.25 ± 0.01) mm.

Percentage error = (0.01 / 0.25) × 100% = 4%

Reference: PYQ - Oct/Nov 2015 Paper 12 Q6

Friday, November 9, 2018

9702/May Jun/12/2015/Q24

Two light waves of the same frequency are represented by the diagram.


What could be the phase difference between the two waves?

A 150°
B 220°
C 260°
D 330°

Solution:
Answer: C

The 2 light waves are said to have the same frequency. The waves have a sinusoidal form.

Let the wave with the larger amplitude be wave A and the one with smaller amplitude be wave B.

Since both waves have a sinusoidal form, we can assume that any of the 2 waves will start at displacement = 0 (we take this point as the reference point), and then move up – just like the wave A at (0, 0).
{In fact, any point (at any displacement) could be taken as the reference point, but in this question, it is easier to consider that point.}


On the graph, the x-axis gives the phase angle.
At a phase of 0°, wave B has not yet reaching the starting (reference) point while wave A is already at that point. It is only at a phase of 100° that wave B reached the reference point (or we could say that wave B reaches this point AGAIN at 100°).

The solution of 100° is not available in the 4 choices, so we can say that wave B had actually already reached this point before – we need to find at which phase this was, according to the x-axis in the diagram.

The phase angle is actually between 0° and 359°. A phase difference of 360° is the same as a phase difference of 0° and a phase difference of 1° is the same as a phase difference of 361°, ….

The wavelength of a wave corresponds to a phase difference of 360°. Since the 2 light waves have the same frequency, it means that they are the same wavelength.

So, if wave B reached the reference point again at a phase of 100°, according to the x-axis, going back by a wavelength (by a phase difference of 360°), we can say that previously, wave B had reached the reference point at the phase of
Phase = 100 – 360 = – 260°

As for wave A, it reaches the reference point at a phase of 0° (according to the x-axis).

Thus, phase difference between wave A and B = 0 – (–260) = 260°

Reference: PYQ - May/Jun 2015 Paper 12 Q24

Monday, November 5, 2018

9702/May Jun/12/2015/Q4

The arrow represents the vector R.


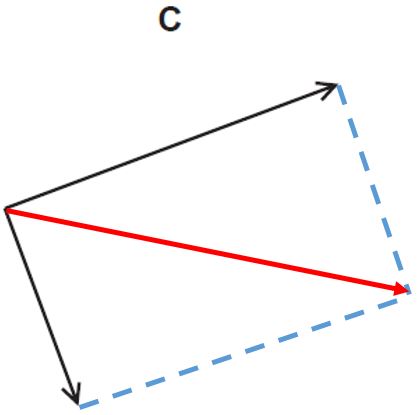
Which diagram does not represent R as two perpendicular components?


Solution:
Answer: C.

When facing such types of question, it is best to tackle it by drawing on the question paper itself.

The vector sum of the two perpendicular components should provide a resultant equal to the vector R shown.


By completing the diagram (by the parallelogram method, for example), we can observe that only choice C does not provide a resultant similar to the vector R shown. Instead, the resultant in C has a downward direction and thus, cannot be equal to the vector R shown.

Reference: PYQ - May/Jun 2015 Paper 12 Q4

9702/May Jun/12/2015/Q3

An analogue ammeter has a pointer which moves over a scale. Following prolonged use, the
pointer does not return fully to zero when the current is turned off and the meter has become less sensitive at higher currents than it is at lower currents.

Which diagram best represents the calibration graph needed to obtain an accurate current
reading?


Solution:
Answer: C.

The scale reading will not start from "0" since the pointer does not return fully to zero when the current is turned off. So choice "A" and "B" are not the answer.

For choice D, the curve line of the graph shows the higher current get higher scale reading. Which means the higher current is more sensitive than lower current.

Only choice C shows the correct reading and fulfill the conditions of the question mentioned.

Reference: PYQ - May/Jun 2015 Paper 12 Q3

9702/May Jun/12/2015/Q7

In an experiment to determine the acceleration of free fall g, a ball bearing is held by an
electromagnet. When the current to the electromagnet is switched off, a clock starts and the ball
bearing falls. After falling a distance h, the ball bearing strikes a switch to stop the clock which
measures the time t of the fall.

If systematic errors cause t and h to be measured incorrectly, which error must cause g to
appear greater than 9.81 m s–2?

A. h measured as being smaller than it actually is and t is measured correctly
B. h measured as being smaller than it actually is and t measured as being larger than it actually is
C. h measured as being larger than it actually is and t measured as being larger than it actually is
D. h is measured correctly and t measured as being smaller than it actually is

Solution:
Answer: D.

Gravitational acceleration (symbolized g) is an expression used in physics to indicate the intensity of a gravitational field. It is expressed in meters per second squared (m/s 2 ).
g = m/s 2

Let h = m, t = s .

Consider choice A:
m decrease , t maintain
the gravitational acceleration appear lesser than 9.81 m/s 2

Consider choice B:
m decrease , t increase
the gravitational acceleration appear lesser than 9.81 m/s 2

Consider choice C:
m increase , t increase
the gravitational acceleration appear lesser than 9.81 m/s due to s is power 2.

Consider choice D:
m maintain, t decrease
the gravitational acceleration appear greater than 9.81 m/s 2.


Reference: PYQ - May/Jun 2015 Paper 12 Q7

9702/May Jun/12/2015/Q14

A ladder is positioned on icy (frictionless) ground and is leant against a rough wall. At the instant
of release it begins to slide.
Which diagram correctly shows the directions of the forces P, W and R acting on the ladder as it
slides?

Solution:
Answer: B.
W is the weight and always acts downwards.
R is the normal reaction to the weight and acts upwards (since ground is frictionless).

For this question, you need to imagine this as a real case – how the ladder would move when it slides.

Before the ladder begins to slide, there is a horizontal force acting to the right at the point of contact of the ladder with the rough wall since the ladder itself exerts a force to the left on the wall due to its mass.
(Diagram A corresponds to this [case where no friction acts and the ladder is not sliding] – The angle of the weight with the ladder is not zero, so there is a component of the weight acting against wall. From Newton’s 3rd law, there is a reaction from the wall – this is P before the ladder begins to slide).

As the ladder begins to slide, the point of contact of the ladder with the rough wall tends to move downwards. Since the wall is rough friction would act upwards, opposing the motion. So, at the point of contact, there is now a force to the right, along with a force acting upwards, the resultant of which is shown by P in diagram B.

The ground is frictionless, so there is no additional force opposing the motion.

Reference: PYQ - May/Jun 2015 Paper 12 Q14

9702/May Jun/12/2015/Q15

A uniform solid block has weight 500 N, width 0.4 m and height 0.6 m. The block rests on the edge
of a step of depth 0.8 m, as shown.
The block is knocked over the edge of the step and rotates through 90° before coming to rest with
the 0.6 m edge horizontal.

What is the change in gravitational potential energy of the block?

A 300 J 
B 400 J 
C 450 J 
D 550 J

Solution:
Answer: C.

Since the block is said to be uniform, the centre of mass can be considered to be at the centre.


At the top of the step,
Height of position of centre of mass above ground = 0.8 + (0.6/2) = 0.8 + 0.3 = 1.1 m


At the bottom of the step,
Height of position of centre of mass above ground = 0.4/2 = 0.2 m


Change in GPE = mgΔh = 500 × (1.1 – 0.2) = 450 J

Reference: PYQ - May/Jun 2015 Paper 12 Q15

9702/May Jun/12/2015/Q30

A charged oil drop of mass m, with n excess electrons, is held stationary in the uniform electric
field between two horizontal plates separated by a distance d.


The voltage between the plates is V, the elementary charge is e and the acceleration of free fall
is g.

What is the value of n ?


Solution:
Answer: B.


Electric field intensity = F/ne = V/d
F = mg
mg/ne = V/d
mgd = neV
n = mgd /eV
Reference: PYQ - May/Jun 2015 Paper 12 Q30